Income inequality within countries and regions
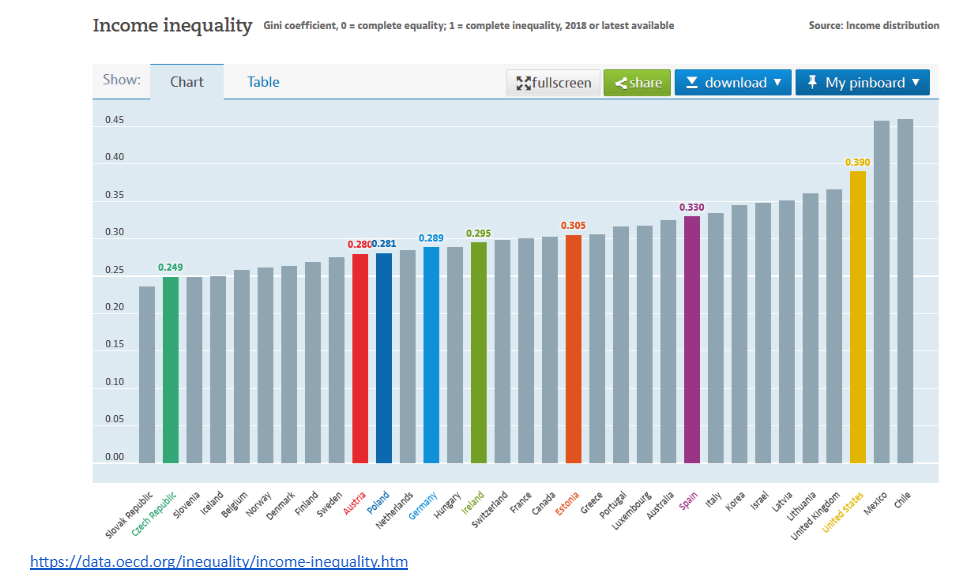
After having looked at global inequality, let’s focus on inequalities within countries and how they evolved. The following graph shows the Gini coefficient for income inequality in OECD countries (17). The income distribution within countries is very different, with nations like Czech Republic, Iceland and Norway being amongst the most equal ones, and the United Kingdom, the United States and Chile showing very unequal income distributions.
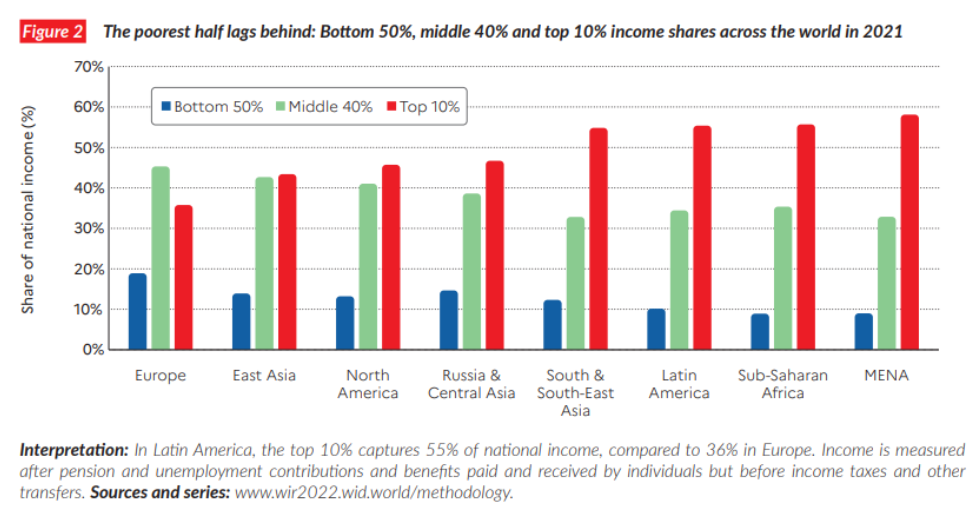
The following figure shows income inequality levels across the regions. Inequality varies significantly between the most equal region (Europe) and the most unequal (Middle East and North Africa i.e. MENA). In Europe, the top 10% income share is around 36%, whereas in MENA it reaches 58%. (18)
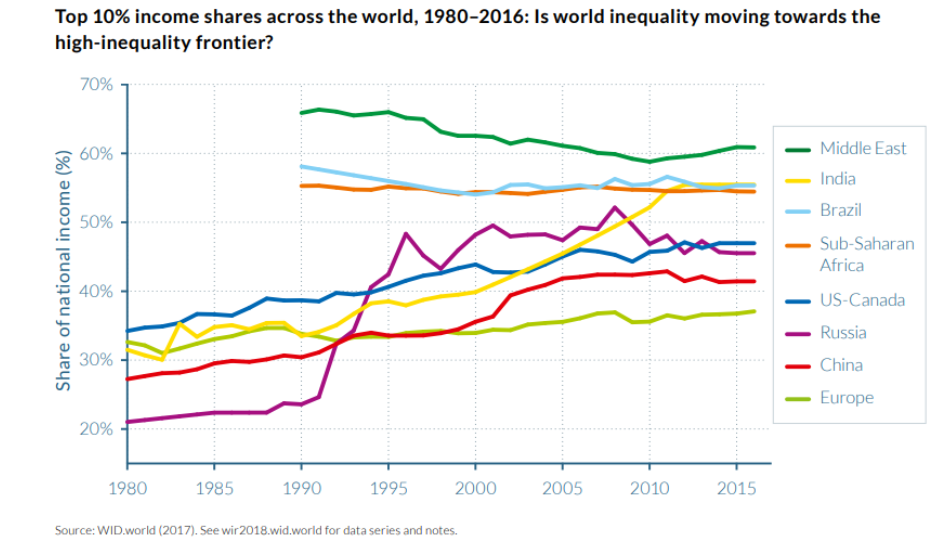
Nearly everywhere income inequality has increased in the last decades, however, at different speeds. This shows that national institutions and policies matter. The following figure shows that in North America, Russia, China and India inequality has grown rapidly, whereas it grew more moderately in Europe. In countries and Regions with extremely high inequality, like Brazil and Sub-Saharan Africa, inequality has remained relatively stable. (19)
An important cause of rising income inequality is the changed relation of power between labour and capital in an open world economy. Capital is inherently more mobile than labour, which limits the bargaining power of wage earners: much of financial capital can “migrate” in a fraction of a second, while the mobility of workers is limited by national borders, but also by social factors such as family, friends and possibly a home of one’s own.
From the 1980s onward global financial flows and trade were deregulated, a shift in policy that was often labelled the “Washington Consensus”. Since then, many unions have lost power and the wage share, i.e., the share of earned income in national income, declined in most industrialised nations, while the share of capital income rose. For fear of locational competition, the average statutory corporate tax rate fell from 49% (1985) to 24% (2018) worldwide. (20)