Exploration of international trade flows helps to uncover effects of economic cooperation and competition. There are different ways of conducting trade analysis. To begin with, one can start from a general description, like a trade volume and main trade partners. The analysis can be conducted in absolute and relative terms (percentages). Then the analysis can be focused on bilateral trade among selected countries (for instance top trading partners).
It is important to describe both the current situation and refer it to the past. To analyze trends one should check data in a longer period of time (at least three years). To find out if trade promotes economic competition and cooperation one should assess trade balance (export minus import) for the last one or more years and calculate its cumulative sum.
Some suggestions regarding how to do trade analysis to examine competition and cooperation in the EU are presented in Table 7.
Table 7. Evidence for economic results of competition and cooperation
Competition | Cooperation | |
Intra-EU trade | What is the trade balance (export-import) for any country within Europe? Is the country gaining or losing economically? How has its trade balance changed during the last 3-5 years? | Exports and imports within EU: effects on employment and income |
Extra-EU trade | EU exports to the world: effects on employment and income | How EU membership helps with trade development for any country? Is the country gaining or losing economically? How has its trade / trade balance changed during the last 3-5 years? |
To assess to what extent any country is engaged in international trade or in other words how open its economy is, one can use a ratio of export value (or sum of export and import) to GDP. The measure is simple and easy to calculate but it is not a perfect one. For example, it is not suitable for comparison between small and big economies, because the bigger the country’s economy is, the smaller its trade as a percentage of GDP.
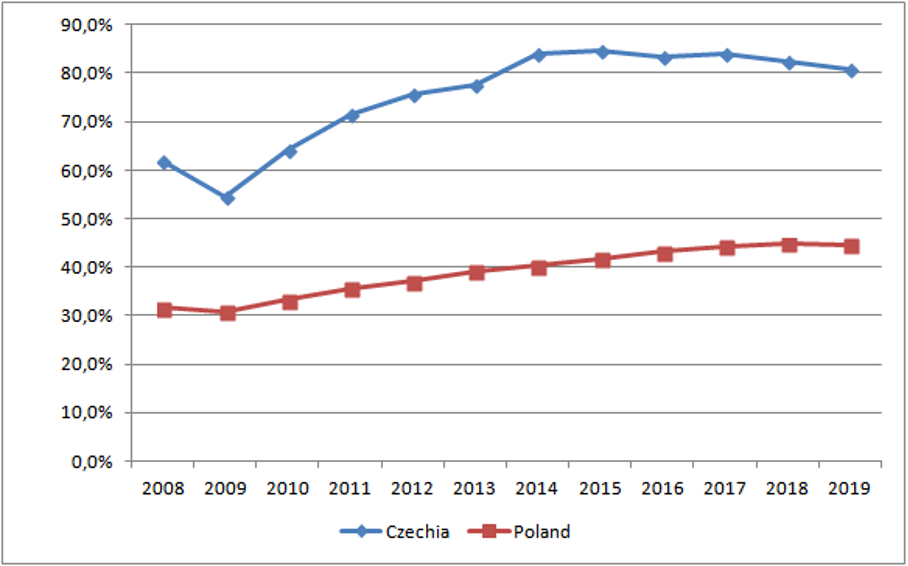
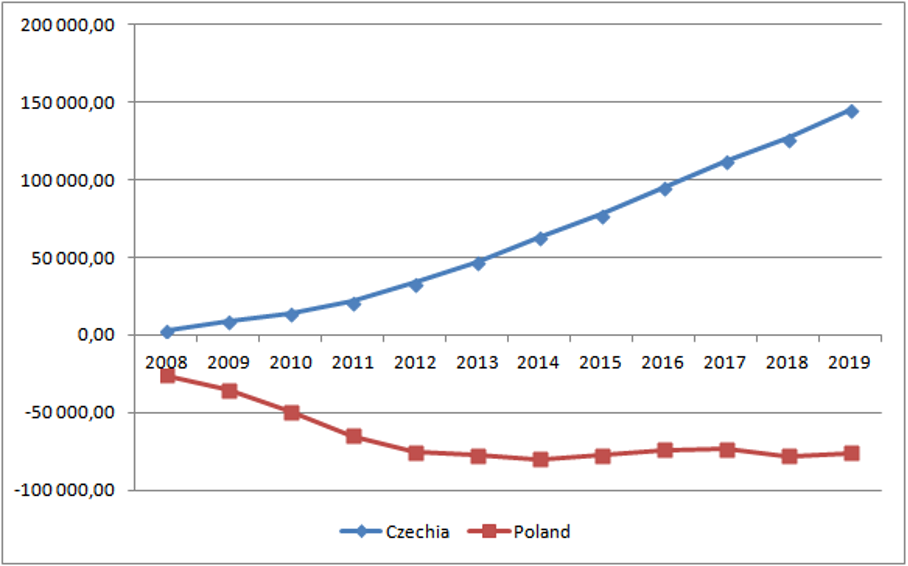
For example, overall trade effects can be shown using real data in the Czechia and Poland case. First, in terms of openness Czechia is more trade-oriented than Poland. In 2019 Czechia openness level (exports/GDP) was 80,7% in comparison to 44,6% in Poland (Fig.3). Then the overall trade effect is visible after calculating a cumulative sum of trade balance for Czechia and Poland from 2008 to 2019. While Poland struggles with its negative trade balance, international trade became a success factor for Czechia’s economy, which reaps the gains of a positive trade balance in a systematic way (Fig.4).